
Gallup’s Analysis of Cannabis Trends in Different Demographics
The TDR Three Takeaways for Gallup’s Analysis of Cannabis Trends:
- The Gallup Poll previously had shown a rise in support for cannabis legalization in the U.S. to 70% in 2023.
- In the USA regular cannabis usage is reported at 9%, with significant demographic variations noted by the Gallup Poll.
- The political implications of cannabis views and usage may influence upcoming election strategies.
Gallup has released the results of its updated findings of Cannabis use and views in the US. The analysis is from the Gallup National Health and Well-Being Index. It is based on a web survey of 6,386 U.S. adults conducted from November 30 to December 8, 2023. The survey was part of the Gallup Panel, which is a probability-based panel that covers all 50 states and the District of Columbia. One of the main questions used to assess cannabis use, Gallup asked the following question: “Keeping in mind that this is confidential, how many days in the last month have you used cannabis products (such as smoking marijuana, vaping liquid THC, or consuming baked goods or gummies) to alter your mood and help you relax?”
First, before we consider the results of the more detailed questions, let’s look at support for legalization of Cannabis. The Gallup Poll has previously reported a dramatic rise in public approval, from 25% in 1995 to 70% in 2023, favoring the legalization of marijuana for recreational use. Concurrently, the percentage of U.S. adults who have tried cannabis at some point in their lives has increased from 38% to 50% over the past decade. This change is accompanied by a shift in consumption methods, with vaping becoming a more popular method among cannabis users, especially young adults, as indicated by the Gallup Poll.
The new data ccording to the Gallup Poll, 9% of U.S. adults report using cannabis regularly, defined as consuming cannabis products like marijuana, vaping liquid THC, or edibles at least ten days per month. The Gallup Poll illustrates significant disparities in cannabis use across different demographic segments, particularly when analyzed by educational attainment and income levels. Notably, 13% of individuals with a high school education or less and 16% of those in households earning less than $24,000 annually engage in regular cannabis use. These figures starkly contrast with the lower rates of 5% among individuals with postgraduate education and those in the highest income bracket, earning over $180,000 per year.
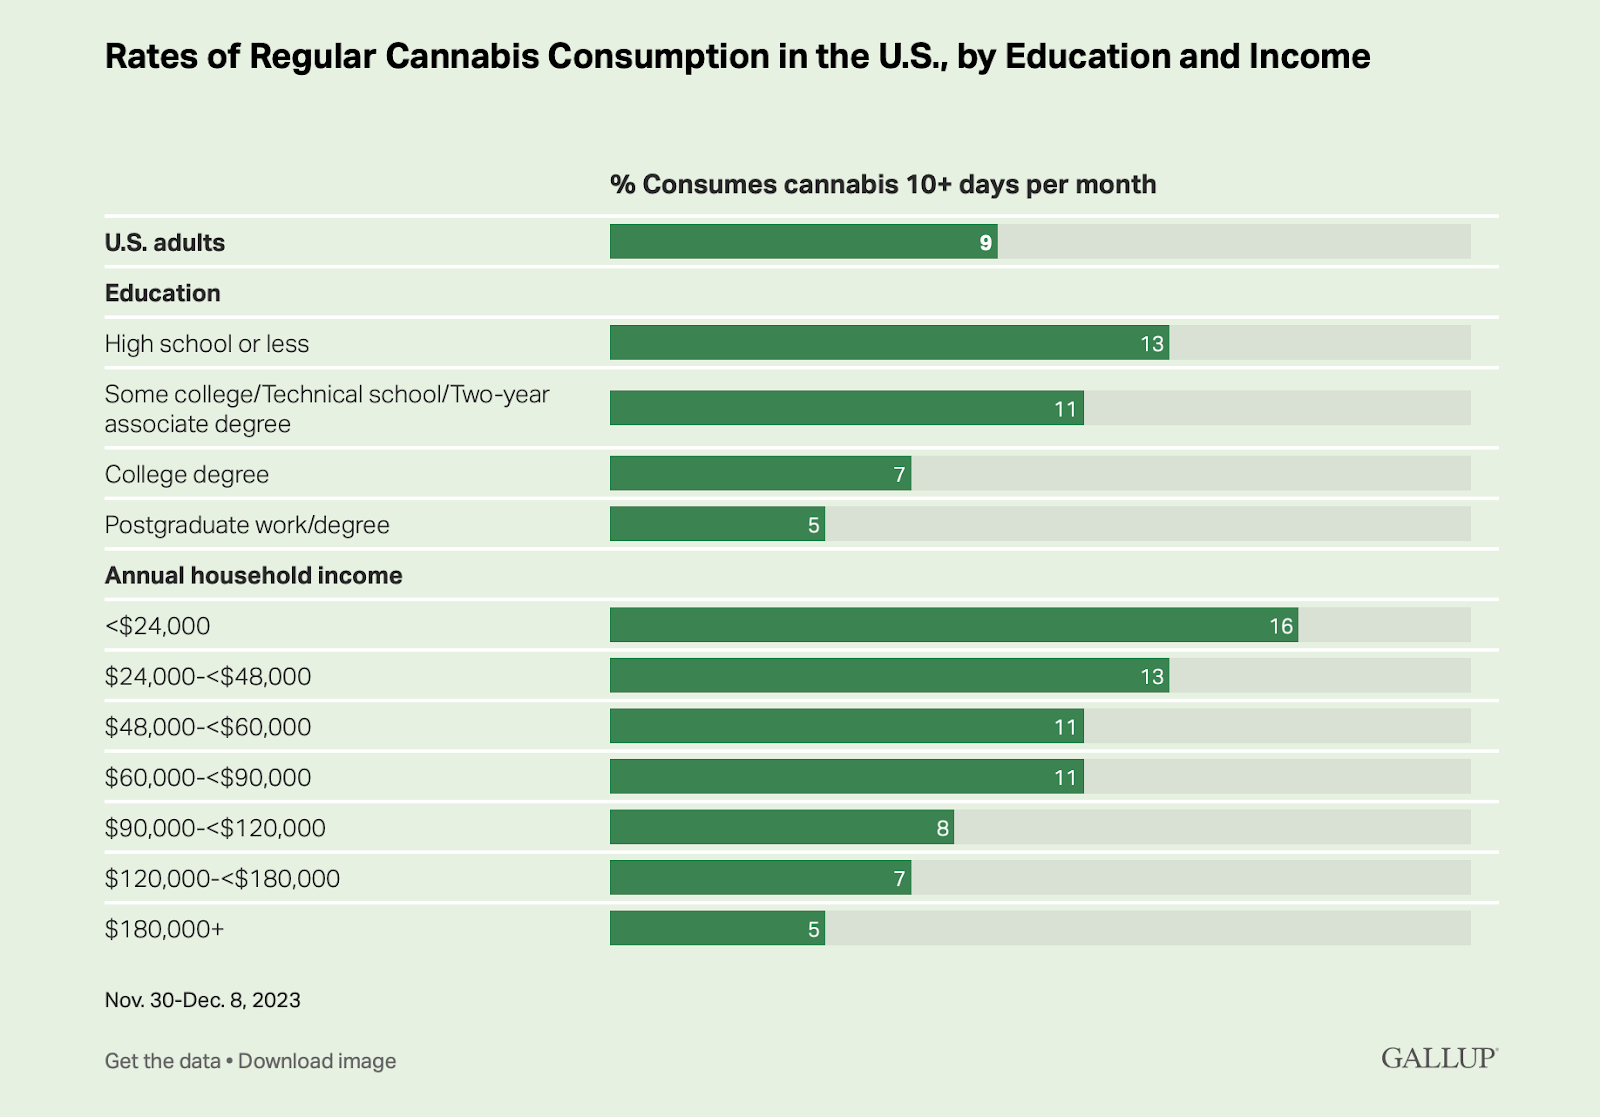
The Gallup Poll’s insights extend to age and gender differences in cannabis consumption. Adults under the age of 50 are twice as likely to use cannabis regularly compared to those aged 65 and older, with rates of 12% versus 6%, respectively. Men are reported at an 11% usage rate, slightly higher than the 8% observed among women. Additionally, the Gallup Poll finds minimal differences in cannabis use among racial groups, indicating a broad demographic spread of cannabis consumption.
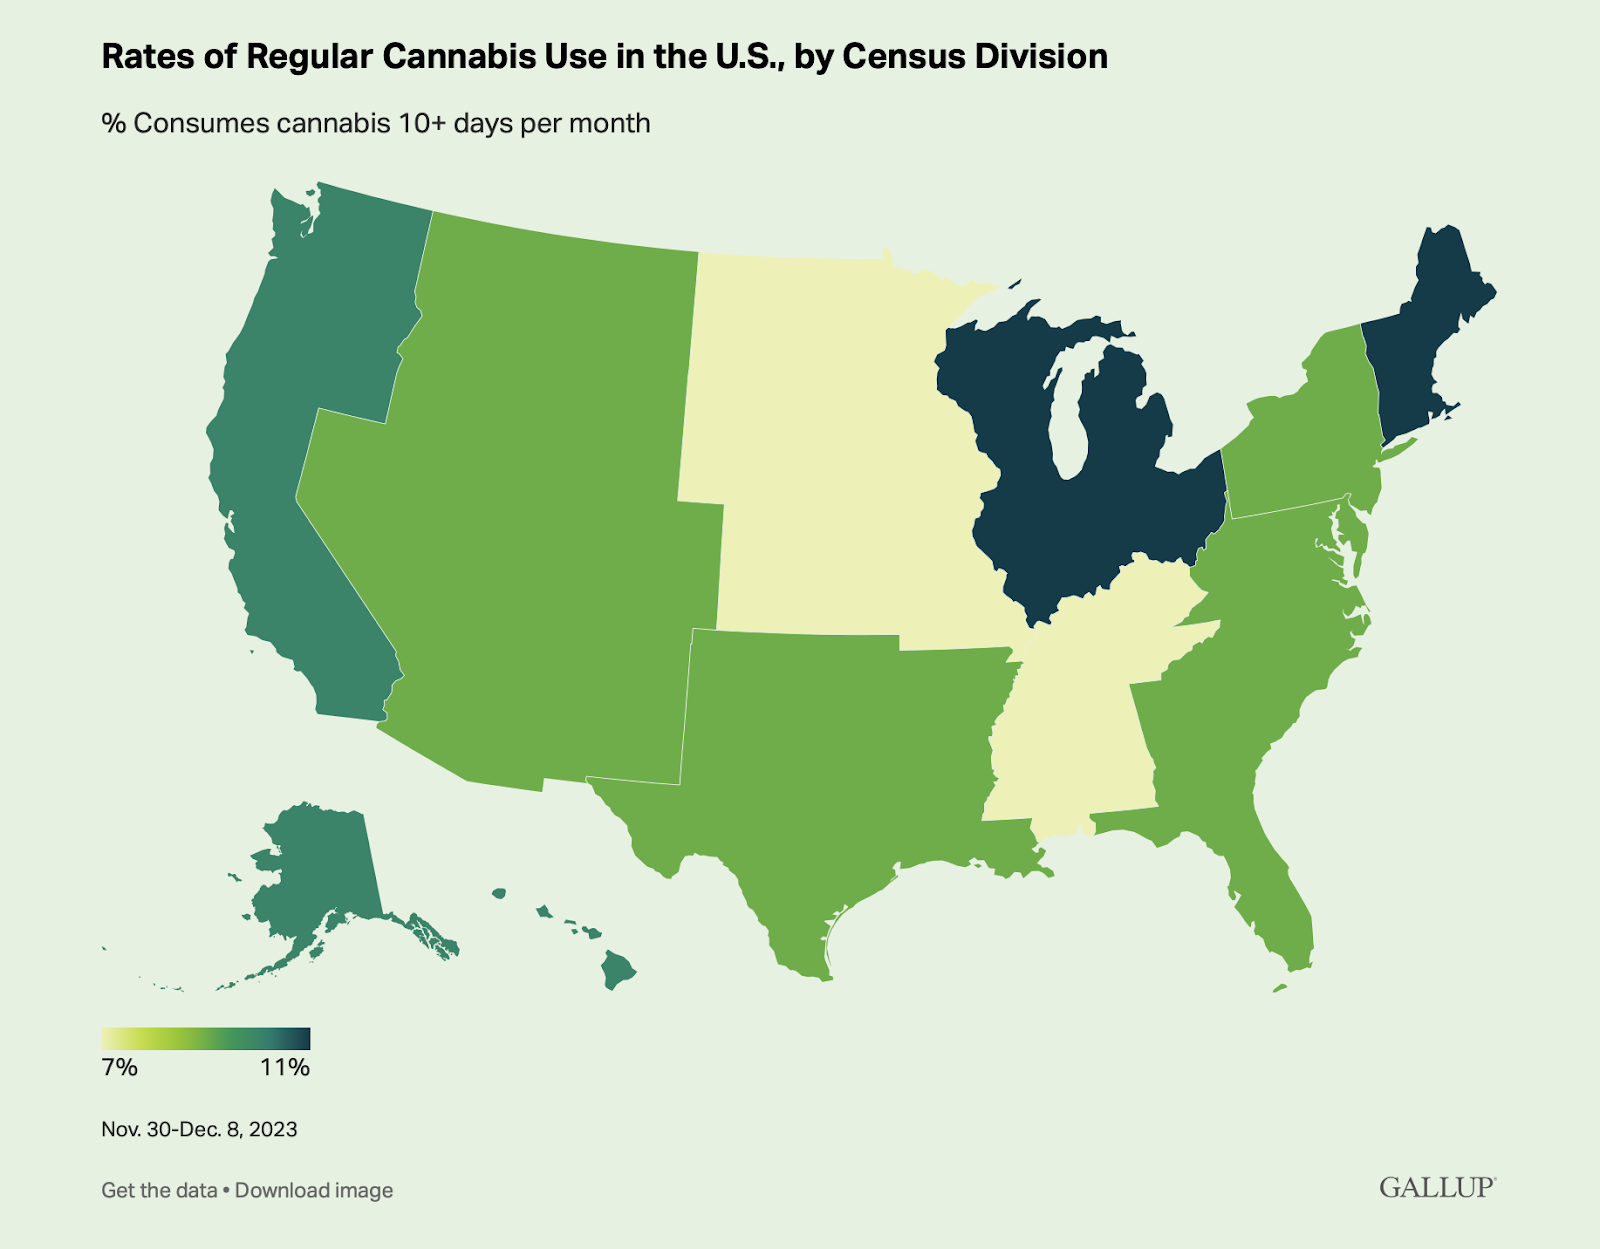
Geographically, the Gallup Poll identifies the highest rates of regular cannabis use in the Middle Atlantic and East North Central regions of the United States, each with an 11% usage rate. These areas contrast with the lower rates found in the East South Central and West North Central regions. This geographical variance aligns closely with political and legal landscapes, as the Gallup Poll notes that regular cannabis use tends to be slightly higher in politically blue states compared to red ones. However, when analyzing the impact of state laws on cannabis use, the Gallup Poll reports little difference in the rates of cannabis consumption between states with legalized marijuana and those where it remains illegal.
Going into an election year, it seems that both parties will have to realize that voters in both parties in most states support cannabis legalization. This is consistent with TDR’s recent trip to Washington which showed politicians on both sides of the aisle contemplating their views on SAFE Banking and rescheduling. Want to keep up to date with all of TDR’s research and news, subscribe to our daily Baked In newsletter.
