
Viridian Capital Advisors Data Shows Sharp Increase In Tier-1 MSOS Enterprise Values In Q4
Over the last four weeks, the total enterprise values of the tier-one MSOs shown in the graph have increased by 20.5% due to sharp increases in stock prices. Total enterprise values are now down approximately 20% from the beginning of 2021.
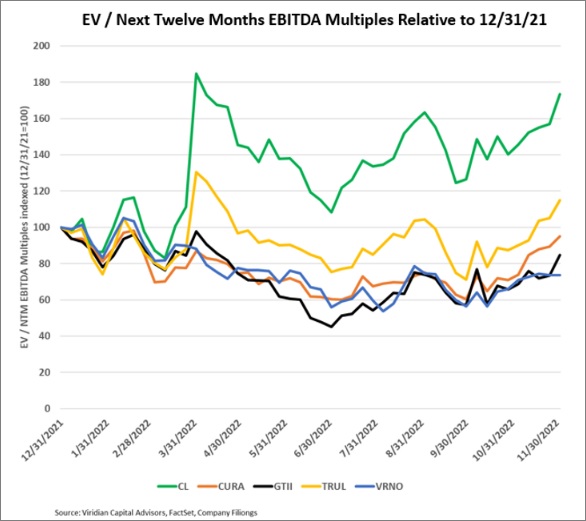
The chart depicts the enterprise value to next twelve months EBITDA multiples for each of the top five MSOs, indexed to 12/31/21. The top green line, for example, represents Cresco Labs CRLBF, whose current multiple of NTM EBITDA is 173% of its 12/31/21 figure (8.3x vs. 8x).
Cresco and Trulieve Cannabis TCNNF multiples are now significantly above their year-end 2021 values, and the group multiple on 12/2/22 was 10.6x compared to a 12/31/21 value of 10.4x. The decline in value is wholly attributable to reductions in consensus estimates of next twelve months EBITDA.
The multiples of Green Thumb Industries GTBIF and Verano Holdings VRNOF, the bottom two lines on the graph, have not yet recovered to 12/31/21 levels. Still, their combined enterprise values have declined by only 13% vs. the group average of 20% because analysts have only reduced their EBITDA estimates by around 3% during the year.
Now that multiples have returned to their beginning-of-the-year levels, how much more improvement can we expect? Multiples during 2021 averaged over 15x and hit peaks of over 20x early in the year when hopes for legalization were highest.
The passage of the SAFE+ bill (which we now feel is highly probable) is likely to be the catalyst that takes multiples back to the 15x+ range. The initial jump may be less than 50% as we believe the more critical indirect impacts of the bill’s passage, such as eventual uplistings, may take time to develop.
It is important to note that the SAFE+ act is only the opening act. Down-scheduling to a level that removes 280e will have a more significant financial impact on the tier-one MSOs. We do not anticipate full federal legalization to occur anytime soon. Moreover, we think that maintenance of state-run limited license regulation is a positive for the companies on this chart.
The Viridian Capital Chart of the Week highlights key investment, valuation and M&A trends taken from the Viridian Cannabis Deal Tracker.
The Viridian Cannabis Deal Tracker provides the market intelligence that cannabis companies, investors, and acquirers utilize to make informed decisions regarding capital allocation and M&A strategy. The Deal Tracker is a proprietary information service that monitors capital raise and M&A activity in the legal cannabis, CBD, and psychedelics industries. Each week the Tracker aggregates and analyzes all closed deals and segments each according to key metrics:
- Deals by Industry Sector (To track the flow of capital and M&A Deals by one of 12 Sectors – from Cultivation to Brands to Software)
- Deal Structure (Equity/Debt for Capital Raises, Cash/Stock/Earnout for M&A) Status of the company announcing the transaction (Public vs. Private)
- Principals to the Transaction (Issuer/Investor/Lender/Acquirer) Key deal terms (Pricing and Valuation)
- Key Deal Terms (Deal Size, Valuation, Pricing, Warrants, Cost of Capital)
- Deals by Location of Issuer/Buyer/Seller (To Track the Flow of Capital and M&A Deals by State and Country)
- Credit Ratings (Leverage and Liquidity Ratios)
Since its inception in 2015, the Viridian Cannabis Deal Tracker has tracked and analyzed more than 2,500 capital raises and 1,000 M&A transactions totaling over $50 billion in aggregate value.
__________
This article was originally published on Benzinga and appears here with permission.
